
Blue Mountain Christian vs. Albany College of Pharmacy and Health Sciences
Blue Mountain Christian ranked #-1 and Albany College of Pharmacy and Health Sciences ranked #-1 in national university ranking. The following statements compare Blue Mountain Christian University and Albany College of Pharmacy and Health Sciences with important academic statistics including tuition, test scores, and admission rate.
- Both schools are private.
- Albany College of Pharmacy and Health Sciences's tuition ($41,125) is more expensive than Blue Mountain Christian ($20,180).
- Albany College of Pharmacy and Health Sciences's acceptance rate (52.69%) is lower than Blue Mountain Christian (88.95%).
- Blue Mountain Christian has higher yield (56.52%) than Albany College of Pharmacy and Health Sciences (6.65%).
- Both schools have same SAT scores of 1,240.
- Albany College of Pharmacy and Health Sciences's students to faculty ratio (10 to 1) is lower than Blue Mountain Christian (13 to 1).
- Blue Mountain Christian (968 students) is larger than Albany College of Pharmacy and Health Sciences (908 students) with more enrolled students.
- Albany College of Pharmacy and Health Sciences ($22,588) has higher amount of financial aid than Blue Mountain Christian ($15,641).
- Albany College of Pharmacy and Health Sciences's graduation rate (68%) is higher than Blue Mountain Christian (55%).

Offered Degrees
Bachelor's
Master's
Master's
Tuition & Fees
$20,180
Financial Aid
$15,641
Test Scores
Admission
88.95% Acceptance Rate
56.52% Yield
Enrollment
912 Undergraduate
56 Graduate
194 Online Students
Graduation Rate
55% Graduation Rate
29% Transfer-out Rate
68% Retention Rate
Faculty & Staff
13 to 1 Students to Faculty
44 Faculties (full-time)
110 Staffs (full-time)
$57,665 Faculty Salary
$41,714 Staff Salary
Learning Opportunities
Teacher Certificate
Campus Living
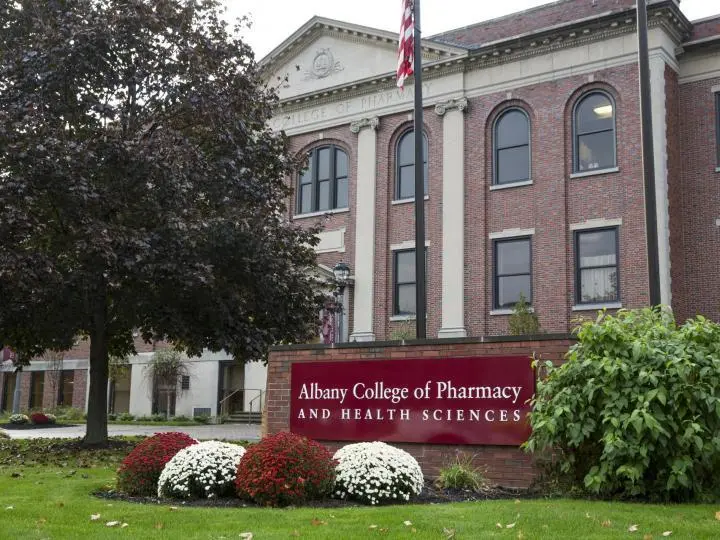
Offered Degrees
Bachelor's
Master's
Doctorate
Master's
Doctorate
Tuition & Fees
$41,125
Financial Aid
$22,588
Test Scores
1,240 SAT
28 ACT
Admission
52.69% Acceptance Rate
6.65% Yield
Enrollment
533 Undergraduate
375 Graduate
5 Online Students
Graduation Rate
68% Graduation Rate
18% Transfer-out Rate
86% Retention Rate
Faculty & Staff
10 to 1 Students to Faculty
71 Faculties (full-time)
198 Staffs (full-time)
$90,579 Faculty Salary
$75,813 Staff Salary
Learning Opportunities
ROTC
Study Abroad
Study Abroad
Campus Living
Add a College
Add a College
Add a College
More rivals of Blue Mountain Christian
- vs. Kansas City Art Institute
- vs. Brite Divinity School
- vs. Midwives College of Utah
- vs. Massachusetts School of Law
- vs. SUNY College of Optometry
- vs. Rabbinical College Bobover Yeshiva Bnei Zion
- vs. The Colleges of Law at Ventura
- vs. CEM College-San Juan
- vs. Gordon-Conwell Theological Seminary
- vs. Pacific States University
- vs. Albizu University-San Juan
- vs. Chattanooga College Medical Dental and & Technical Careers
- vs. Selma University
- vs. Catholic Theological Union at Chicago
- vs. Simpson College
More rivals of Albany College of Pharmacy and Health Sciences
- vs. University of Maine at Presque Isle
- vs. Southern University-Board and System
- vs. Endeavor Health School of Nurse Anesthesia-DePaul University
- vs. Yeshiva Shaar Ephraim
- vs. Yeshiva Karlin Stolin
- vs. Daytona State College
- vs. Chamberlain University-Ohio
- vs. Miller-Motte College-Wilmington
- vs. Houston City College
- vs. Colorado Mesa University
- vs. Ecclesia College
- vs. Charlotte Christian College and Theological Seminary
- vs. California Aeronautical University
- vs. Chandler-Gilbert Community College
- vs. Louisiana State University Health Sciences Center-New Orleans