
CMU CLAS vs. Albany College of Pharmacy and Health Sciences
CMU CLAS ranked #-1 and Albany College of Pharmacy and Health Sciences ranked #-1 in national university ranking. The following statements compare Central Methodist University-College of Liberal Arts and Sciences and Albany College of Pharmacy and Health Sciences with important academic statistics including tuition, test scores, and admission rate.
- Both schools are private.
- Albany College of Pharmacy and Health Sciences's tuition ($41,125) is more expensive than CMU CLAS ($28,620).
- Albany College of Pharmacy and Health Sciences's acceptance rate (52.69%) is lower than CMU CLAS (56.87%).
- CMU CLAS has higher yield (35.12%) than Albany College of Pharmacy and Health Sciences (6.65%).
- Albany College of Pharmacy and Health Sciences's SAT score (1,240) is higher than CMU CLAS (995).
- Albany College of Pharmacy and Health Sciences's students to faculty ratio (10 to 1) is lower than CMU CLAS (12 to 1).
- CMU CLAS (1,041 students) is larger than Albany College of Pharmacy and Health Sciences (908 students) with more enrolled students.
- Albany College of Pharmacy and Health Sciences ($22,588) has higher amount of financial aid than CMU CLAS ($21,159).
- Albany College of Pharmacy and Health Sciences's graduation rate (68%) is higher than CMU CLAS (51%).
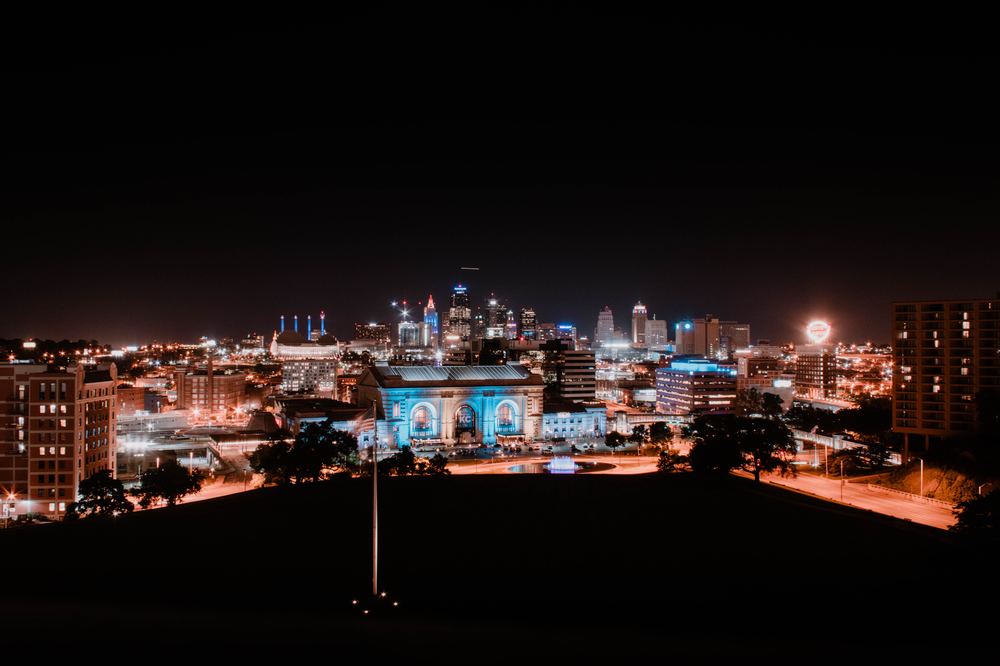
Central Methodist University-College of Liberal Arts and Sciences
Private, 4 years • Fayette, MO more rivalsOffered Degrees
Associate
Bachelor's
Bachelor's
Tuition & Fees
$28,620
Financial Aid
$21,159
Test Scores
995 SAT
20 ACT
Admission
56.87% Acceptance Rate
35.12% Yield
Enrollment
1,041 (All undergraduate)
Graduation Rate
51% Graduation Rate
34% Transfer-out Rate
62% Retention Rate
Faculty & Staff
12 to 1 Students to Faculty
78 Faculties (full-time)
240 Staffs (full-time)
$60,551 Faculty Salary
$51,617 Staff Salary
Learning Opportunities
ROTC
Study Abroad
Teacher Certificate
Study Abroad
Teacher Certificate
Campus Living
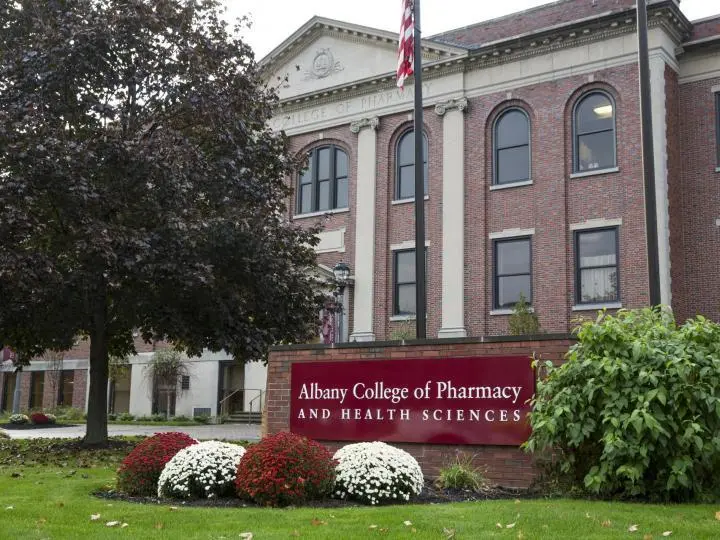
Offered Degrees
Bachelor's
Master's
Doctorate
Master's
Doctorate
Tuition & Fees
$41,125
Financial Aid
$22,588
Test Scores
1,240 SAT
28 ACT
Admission
52.69% Acceptance Rate
6.65% Yield
Enrollment
533 Undergraduate
375 Graduate
5 Online Students
Graduation Rate
68% Graduation Rate
18% Transfer-out Rate
86% Retention Rate
Faculty & Staff
10 to 1 Students to Faculty
71 Faculties (full-time)
198 Staffs (full-time)
$90,579 Faculty Salary
$75,813 Staff Salary
Learning Opportunities
ROTC
Study Abroad
Study Abroad
Campus Living
Add a College
Add a College
Add a College
More rivals of CMU CLAS
- vs. Adler University
- vs. Hesston College
- vs. Christ Mission College
- vs. Bethany College
- vs. Roseman University of Health Sciences
- vs. Inter American University of Puerto Rico-Fajardo
- vs. Western Theological Seminary
- vs. Daytona College
- vs. Maine College of Health Professions
- vs. Rosalind Franklin University of Medicine and Science
- vs. DeVry University-Arizona
- vs. Columbia University in the City of New York
- vs. Appalachian Bible College
- vs. Davis & Elkins College
- vs. Heritage Christian University
More rivals of Albany College of Pharmacy and Health Sciences
- vs. Benedict College
- vs. Dewey University-Hato Rey
- vs. North Central State College
- vs. Limestone University
- vs. Angeles College
- vs. Chowan University
- vs. University of Maine at Farmington
- vs. Antelope Valley Community College District
- vs. Cleveland Institute of Art
- vs. Meadville Theological School of Lombard College
- vs. Beth Medrash Govoha
- vs. Southeastern Free Will Baptist Bible College
- vs. Denver College of Nursing
- vs. Kent State University at Trumbull
- vs. Spring Hill College