
Kent State University at East Liverpool vs. OSU
Both Kent State University at East Liverpool and Ohio State University-Main Campus are Public, 4 years schools located in Ohio. The following statements compare Kent State University at East Liverpool and Ohio State University-Main Campus with important academic statistics including tuition, test scores, and admission rate.
- Both schools are public.
- OSU's tuition ($40,022) is more expensive than Kent State University at East Liverpool ($17,969).
- OSU's acceptance rate (60.57%) is lower than OSU (60.57%).
- OSU has higher yield (21.78%) than OSU (21.78%).
- Both schools have same SAT scores of 1,400.
- OSU's students to faculty ratio (16 to 1) is lower than Kent State University at East Liverpool (37 to 1).
- OSU (61,443 students) is larger than Kent State University at East Liverpool (1,196 students) with more enrolled students.
- OSU ($12,876) has higher amount of financial aid than Kent State University at East Liverpool ($4,558).
- OSU's graduation rate (88%) is higher than Kent State University at East Liverpool (26%).

Offered Degrees
Certificate Programs
Associate
Bachelor's
Associate
Bachelor's
Tuition & Fees
$8,211 In-State
$17,969 out-of-state
$17,969 out-of-state
Financial Aid
$4,558
Test Scores
Admission
Enrollment
1,196 (All undergraduate)
943 Online Students
Graduation Rate
26% Graduation Rate
8% Transfer-out Rate
33% Retention Rate
Faculty & Staff
37 to 1 Students to Faculty
14 Faculties (full-time)
28 Staffs (full-time)
$79,689 Faculty Salary
$50,326 Staff Salary
Learning Opportunities
Study Abroad
Campus Living
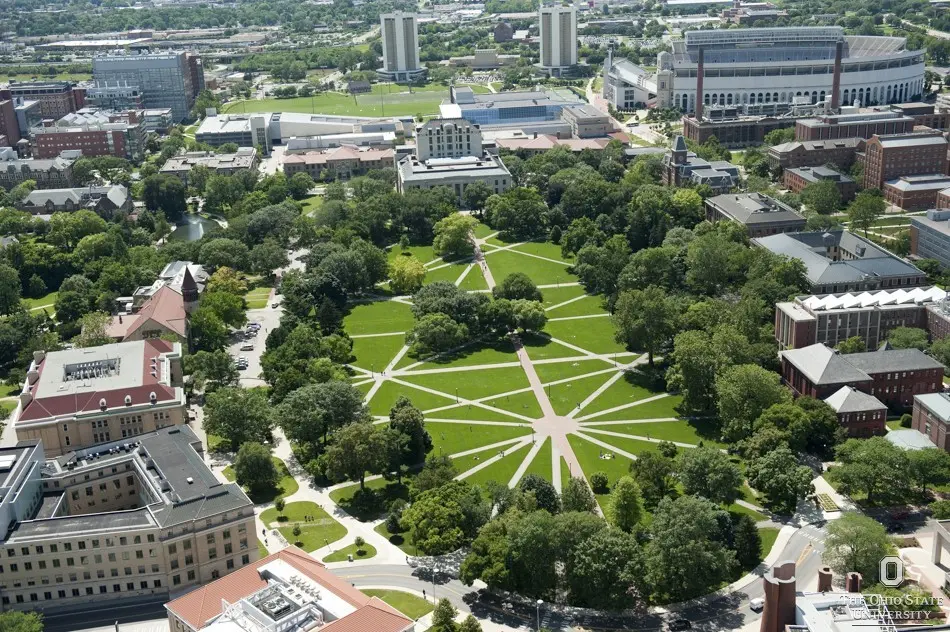
Ohio State University-Main Campus
Public, 4 years • Columbus, OH #116 National Universities, #2 in Ohio more rivalsOffered Degrees
Certificate Programs
Associate
Bachelor's
Post-Graduate Certificate
Master's
Doctorate
Associate
Bachelor's
Post-Graduate Certificate
Master's
Doctorate
Tuition & Fees
$13,244 In-State
$40,022 out-of-state
$40,022 out-of-state
Financial Aid
$12,876
Test Scores
1,400 SAT
30 ACT
Admission
60.57% Acceptance Rate
21.78% Yield
Enrollment
46,815 Undergraduate
14,628 Graduate
3,975 Online Students
Graduation Rate
88% Graduation Rate
94% Retention Rate
Faculty & Staff
16 to 1 Students to Faculty
5,014 Faculties (full-time)
33,271 Staffs (full-time)
$131,274 Faculty Salary
$78,636 Staff Salary
Learning Opportunities
ROTC
Study Abroad
Evening College
Teacher Certificate
Study Abroad
Evening College
Teacher Certificate
Campus Living
Add a College
Add a College
Add a College
More rivals of Kent State University at East Liverpool
- vs. Central State University
- vs. Pontifical College Josephinum
- vs. Chamberlain University-Ohio
- vs. Bryant & Stratton College-Parma
- vs. ITT Technical Institute-Warrensville Heights
- vs. The Art Institute of Cincinnati-AIC College of Design
- vs. Bryant & Stratton College-Akron
- vs. University of Rio Grande
- vs. Zane State College
- vs. Ohio State University-Lima Campus
- vs. Lakewood University
- vs. Bryant & Stratton College-Akron
- vs. Ohio University-Southern Campus
- vs. South University-Cleveland
- vs. Franciscan University of Steubenville
More rivals of OSU
- vs. University of Iowa
- vs. University of Washington-Seattle Campus
- vs. University of California-Los Angeles
- vs. Pennsylvania State University-Main Campus
- vs. University of Southern California
- vs. Purdue University-Main Campus
- vs. Northwestern University
- vs. Indiana University-Bloomington
- vs. Michigan State University
- vs. University of Minnesota-Twin Cities
- vs. University of Wisconsin-Madison
- vs. University of Oregon
- vs. University of Maryland-College Park
- vs. University of Michigan-Ann Arbor
- vs. University of Nebraska-Lincoln