
Compare Lincoln University and Pennsylvania State University-Penn State Greater Allegheny
Lincoln ranked #-1 and Penn State Greater Allegheny ranked #-1 in national university ranking. The following statements compare Lincoln University and Pennsylvania State University-Penn State Greater Allegheny with important academic statistics including tuition, test scores, and admission rate.
- Both schools are public.
- Penn State Greater Allegheny's tuition ($24,134) is more expensive than Lincoln ($17,692).
- Penn State Greater Allegheny's acceptance rate (96.47%) is lower than Penn State Greater Allegheny (96.47%).
- Penn State Greater Allegheny has higher yield (19.46%) than Penn State Greater Allegheny (19.46%).
- Both schools have same SAT scores of 1,160.
- Penn State Greater Allegheny's students to faculty ratio (9 to 1) is lower than Lincoln (11 to 1).
- Lincoln (2,054 students) is larger than Penn State Greater Allegheny (352 students) with more enrolled students.
- Penn State Greater Allegheny ($11,736) has higher amount of financial aid than Lincoln ($7,810).
- Lincoln's graduation rate (21%) is higher than Penn State Greater Allegheny (19%).
Add More College

Lincoln University
Public, 4 years • Jefferson City, MOOffered Degrees
Certificate Programs
Associate
Bachelor's
Post-Graduate Certificate
Master's
Associate
Bachelor's
Post-Graduate Certificate
Master's
Tuition & Fees
$9,796 In-State
$17,692 out-of-state
$17,692 out-of-state
Financial Aid
$7,810
Test Scores
Admission
Enrollment
1,926 Undergraduate
128 Graduate
138 Online Students
Graduation Rate
21% Graduation Rate
36% Transfer-out Rate
60% Retention Rate
Faculty & Staff
11 to 1 Students to Faculty
88 Faculties (full-time)
358 Staffs (full-time)
$50,845 Faculty Salary
$57,762 Staff Salary
Learning Opportunities
ROTC
Study Abroad
Teacher Certificate
Study Abroad
Teacher Certificate
Campus Living
Remove School
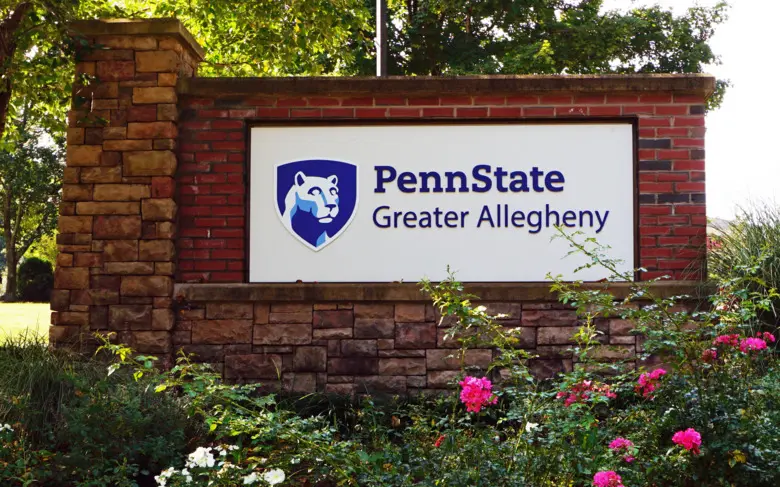
Pennsylvania State University-Penn State Greater Allegheny
Public, 4 years • McKeesport, PAOffered Degrees
Certificate Programs
Associate
Bachelor's
Master's
Associate
Bachelor's
Master's
Tuition & Fees
$14,408 In-State
$24,134 out-of-state
$24,134 out-of-state
Financial Aid
$11,736
Test Scores
1,160 SAT
Admission
96.47% Acceptance Rate
19.46% Yield
Enrollment
352 (All undergraduate)
1 Online Students
Graduation Rate
19% Graduation Rate
33% Transfer-out Rate
78% Retention Rate
Faculty & Staff
9 to 1 Students to Faculty
39 Faculties (full-time)
114 Staffs (full-time)
$91,594 Faculty Salary
$65,892 Staff Salary
Learning Opportunities
ROTC
Study Abroad
Study Abroad
Campus Living
Remove School
Add a College
Add a College
Add a College
More rivals of Lincoln
- vs. Pathways College
- vs. Rush University
- vs. Professional Skills Institute
- vs. Meridian University
- vs. Davis College
- vs. Henry Ford College
- vs. Inter American University of Puerto Rico-Ponce
- vs. Divine Mercy University
- vs. Montreat College
- vs. Herzing University-Kenosha
- vs. Clover Park Technical College
- vs. De Anza College
- vs. Institute of World Politics
- vs. Saint Vincent de Paul Regional Seminary
- vs. Point University
More rivals of Penn State Greater Allegheny
- vs. Morehouse School of Medicine
- vs. Schoolcraft Community College District
- vs. Paul Quinn College
- vs. Touro University California
- vs. American Samoa Community College
- vs. Spartanburg Methodist College
- vs. Donnelly College
- vs. Bryant & Stratton College-Online
- vs. Los Angeles Academy of Figurative Art
- vs. University of New Hampshire-Franklin Pierce School of Law
- vs. Visible Music College
- vs. Culinary Institute Inc
- vs. Design Institute of San Diego
- vs. Rabbinical College Beth Shraga
- vs. Aaniiih Nakoda College