
Los Angeles Mission vs. Albany College of Pharmacy and Health Sciences
Los Angeles Mission ranked #-1 and Albany College of Pharmacy and Health Sciences ranked #-1 in national university ranking. The following statements compare Los Angeles Mission College and Albany College of Pharmacy and Health Sciences with important academic statistics including tuition, test scores, and admission rate.
- Albany College of Pharmacy and Health Sciences's tuition ($41,125) is more expensive than Los Angeles Mission ($10,572).
- Albany College of Pharmacy and Health Sciences's acceptance rate (52.69%) is lower than Albany College of Pharmacy and Health Sciences (52.69%).
- Albany College of Pharmacy and Health Sciences has higher yield (6.65%) than Albany College of Pharmacy and Health Sciences (6.65%).
- Both schools have same SAT scores of 1,240.
- Albany College of Pharmacy and Health Sciences's students to faculty ratio (10 to 1) is lower than Los Angeles Mission (32 to 1).
- Los Angeles Mission (10,690 students) is larger than Albany College of Pharmacy and Health Sciences (908 students) with more enrolled students.
- Albany College of Pharmacy and Health Sciences ($22,588) has higher amount of financial aid than Los Angeles Mission ($2,936).
- Albany College of Pharmacy and Health Sciences's graduation rate (68%) is higher than Los Angeles Mission (20%).

Offered Degrees
Certificate Programs
Associate
Bachelor's
Associate
Bachelor's
Tuition & Fees
$1,238 In-State
$10,572 out-of-state
$10,572 out-of-state
Financial Aid
$2,936
Test Scores
Admission
Enrollment
10,690 (All undergraduate)
6,563 Online Students
Graduation Rate
20% Graduation Rate
8% Transfer-out Rate
Faculty & Staff
32 to 1 Students to Faculty
96 Faculties (full-time)
256 Staffs (full-time)
$116,110 Faculty Salary
$92,637 Staff Salary
Learning Opportunities
Evening College
Teacher Certificate
Teacher Certificate
Campus Living
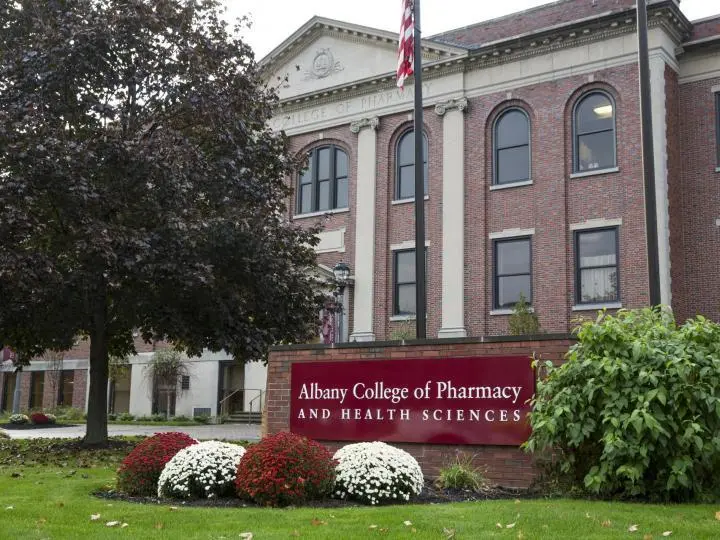
Offered Degrees
Bachelor's
Master's
Doctorate
Master's
Doctorate
Tuition & Fees
$41,125
Financial Aid
$22,588
Test Scores
1,240 SAT
28 ACT
Admission
52.69% Acceptance Rate
6.65% Yield
Enrollment
533 Undergraduate
375 Graduate
5 Online Students
Graduation Rate
68% Graduation Rate
18% Transfer-out Rate
86% Retention Rate
Faculty & Staff
10 to 1 Students to Faculty
71 Faculties (full-time)
198 Staffs (full-time)
$90,579 Faculty Salary
$75,813 Staff Salary
Learning Opportunities
ROTC
Study Abroad
Study Abroad
Campus Living
Add a College
Add a College
Add a College
More rivals of Los Angeles Mission
- vs. Southern University Law Center
- vs. The University of Texas Medical Branch at Galveston
- vs. Flagler College
- vs. Sinclair Community College
- vs. The University of Tennessee Health Science Center
- vs. University of Puerto Rico-Central Administration
- vs. Arizona College of Nursing-Tampa
- vs. Kansas Christian College
- vs. Talmudical Academy-New Jersey
- vs. Ohr Hameir Theological Seminary
- vs. Central Ohio Technical College
- vs. Midwestern Baptist Theological Seminary
- vs. Fond du Lac Tribal and Community College
- vs. Davis College
- vs. Research College of Nursing
More rivals of Albany College of Pharmacy and Health Sciences
- vs. Bais Medrash Mayan Hatorah
- vs. Wilberforce University
- vs. Lake Erie College of Osteopathic Medicine
- vs. Cincinnati State Technical and Community College
- vs. Gordon State College
- vs. College of Biblical Studies-Houston
- vs. Northwestern Health Sciences University
- vs. Southwestern College
- vs. Brazosport College
- vs. Pacific States University
- vs. United Theological Seminary of the Twin Cities
- vs. Larkin University
- vs. Galen Health Institutes-Houston
- vs. Williams Baptist University
- vs. West Coast University-Center for Graduate Studies