
Compare Marion Technical College and Franklin W Olin College of Engineering
Marion Technical ranked #-1 and Franklin W Olin College of Engineering ranked #-1 in national university ranking. The following statements compare Marion Technical College and Franklin W Olin College of Engineering with important academic statistics including tuition, test scores, and admission rate.
- Franklin W Olin College of Engineering's tuition ($63,742) is more expensive than Marion Technical ($11,225).
- Franklin W Olin College of Engineering's acceptance rate (25.20%) is lower than Franklin W Olin College of Engineering (25.20%).
- Franklin W Olin College of Engineering has higher yield (43.65%) than Franklin W Olin College of Engineering (43.65%).
- Both schools have same SAT scores of 1,520.
- Franklin W Olin College of Engineering's students to faculty ratio (9 to 1) is lower than Marion Technical (14 to 1).
- Marion Technical (3,346 students) is larger than Franklin W Olin College of Engineering (405 students) with more enrolled students.
- Franklin W Olin College of Engineering ($42,121) has higher amount of financial aid than Marion Technical ($4,501).
- Franklin W Olin College of Engineering's graduation rate (96%) is higher than Marion Technical (31%).
Add More College

Marion Technical College
Public, 4 years • Marion, OHOffered Degrees
Certificate Programs
Associate
Bachelor's
Associate
Bachelor's
Tuition & Fees
$6,595 In-State
$11,225 out-of-state
$11,225 out-of-state
Financial Aid
$4,501
Test Scores
Admission
Enrollment
3,346 (All undergraduate)
846 Online Students
Graduation Rate
31% Graduation Rate
12% Transfer-out Rate
Faculty & Staff
14 to 1 Students to Faculty
50 Faculties (full-time)
115 Staffs (full-time)
$58,427 Faculty Salary
$69,865 Staff Salary
Learning Opportunities
Study Abroad
Evening College
Evening College
Campus Living
Remove School
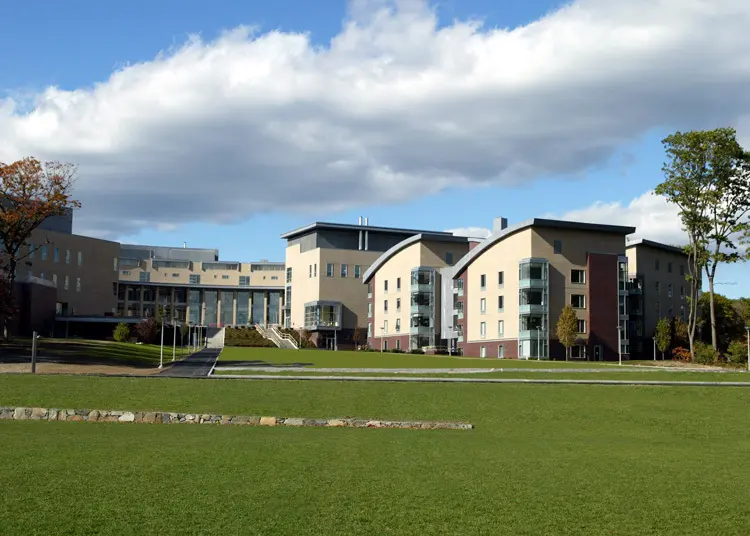
Franklin W Olin College of Engineering
Private, 4 years • Needham, MAOffered Degrees
Bachelor's
Tuition & Fees
$63,742
Financial Aid
$42,121
Test Scores
1,520 SAT
Admission
25.20% Acceptance Rate
43.65% Yield
Enrollment
405 (All undergraduate)
Graduation Rate
96% Graduation Rate
98% Retention Rate
Faculty & Staff
9 to 1 Students to Faculty
47 Faculties (full-time)
121 Staffs (full-time)
$138,216 Faculty Salary
$110,531 Staff Salary
Learning Opportunities
Study Abroad
Campus Living
Remove School
Add a College
Add a College
Add a College
More rivals of Marion Technical
- vs. Ponce Health Sciences University-Centro Universitario de San Juan
- vs. Yeshiva Yesoda Hatorah Vetz Chaim
- vs. University of Colorado System Office
- vs. Teachers College of San Joaquin
- vs. The University of Texas Health Science Center at Houston
- vs. Southern University Law Center
- vs. Whitworth University-Adult Degree Programs
- vs. University of Valley Forge
- vs. InterCoast Colleges-West Covina
- vs. Kent State University at Ashtabula
- vs. Uta Mesivta of Kiryas Joel
- vs. The Chicago School at Los Angeles
- vs. Los Angeles Film School
- vs. Chicago Theological Seminary
- vs. Ohio Northern University
More rivals of Franklin W Olin College of Engineering
- vs. Galen Health Institutes-Asheville
- vs. Arizona College of Nursing - Hartford
- vs. Central Methodist University-College of Liberal Arts and Sciences
- vs. West Coast University-Texas
- vs. Ohio University-Eastern Campus
- vs. Oklahoma Panhandle State University
- vs. Northern Baptist Theological Seminary
- vs. Ambria College of Nursing
- vs. Sonoran University of Health Sciences
- vs. Bluffton University
- vs. SUNY-System Office
- vs. Limestone University
- vs. Western Technical College
- vs. Ecumenical Theological Seminary
- vs. Arizona College of Nursing-Las Vegas