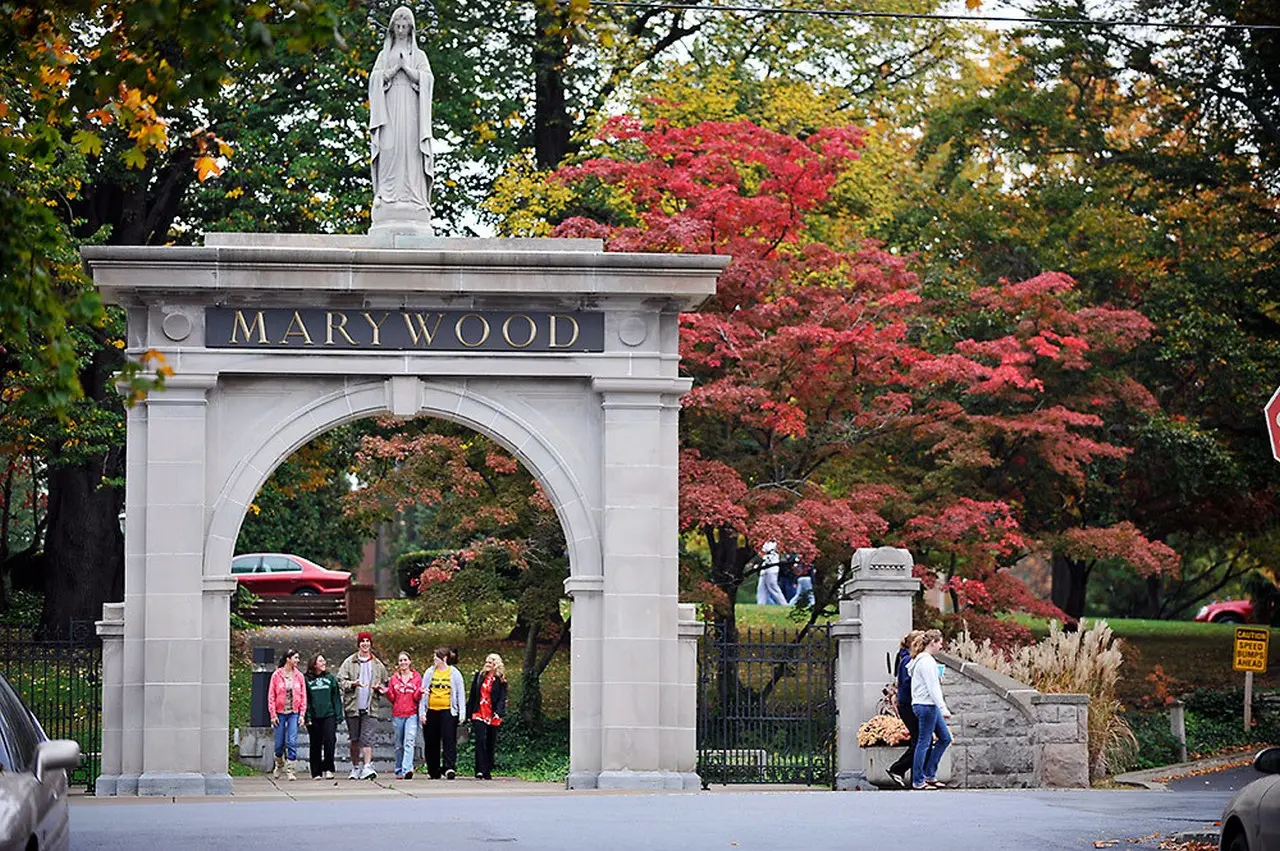
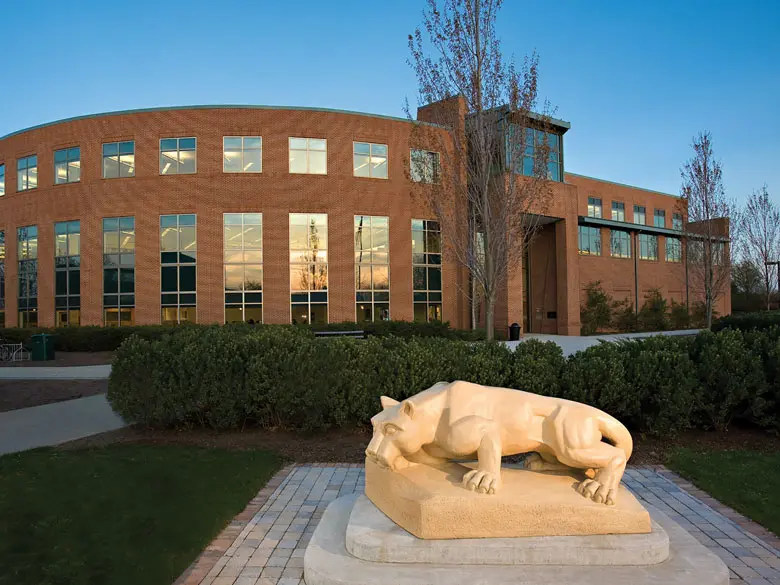
Marywood vs. Penn State Harrisburg
Both Marywood University and Pennsylvania State University-Penn State Harrisburg are 4 years schools located in Pennsylvania. The following statements compare Marywood University and Pennsylvania State University-Penn State Harrisburg with important academic statistics including tuition, test scores, and admission rate.
- Marywood's tuition ($39,570) is more expensive than Penn State Harrisburg ($26,668).
- Marywood's acceptance rate (80.76%) is lower than Penn State Harrisburg (95.55%).
- Marywood has higher yield (20.83%) than Penn State Harrisburg (12.62%).
- Penn State Harrisburg's SAT score (1,210) is higher than Marywood (1,110).
- Marywood's students to faculty ratio (11 to 1) is lower than Penn State Harrisburg (14 to 1).
- Penn State Harrisburg (4,572 students) is larger than Marywood (2,729 students) with more enrolled students.
- Marywood ($24,753) has higher amount of financial aid than Penn State Harrisburg ($10,114).
- Marywood's graduation rate (75%) is higher than Penn State Harrisburg (24%).
Offered Degrees
Certificate Programs
Bachelor's
Post-Graduate Certificate
Master's
Doctorate
Bachelor's
Post-Graduate Certificate
Master's
Doctorate
Tuition & Fees
$39,570
Financial Aid
$24,753
Test Scores
1,110 SAT
23 ACT
Admission
80.76% Acceptance Rate
20.83% Yield
Enrollment
1,857 Undergraduate
872 Graduate
364 Online Students
Graduation Rate
75% Graduation Rate
16% Transfer-out Rate
83% Retention Rate
Faculty & Staff
11 to 1 Students to Faculty
148 Faculties (full-time)
422 Staffs (full-time)
$68,997 Faculty Salary
$45,709 Staff Salary
Learning Opportunities
ROTC
Study Abroad
Teacher Certificate
Study Abroad
Teacher Certificate
Campus Living
Campus Housing Offered
-$8,341 annual charge
-850 capacity
Board/Meal Plan Offered
-$6,355 annual charge
Offered Degrees
Certificate Programs
Associate
Bachelor's
Post-Graduate Certificate
Master's
Doctorate
Associate
Bachelor's
Post-Graduate Certificate
Master's
Doctorate
Tuition & Fees
$15,944 In-State
$26,668 out-of-state
$26,668 out-of-state
Financial Aid
$10,114
Test Scores
1,210 SAT
26 ACT
Admission
95.55% Acceptance Rate
12.62% Yield
Enrollment
4,063 Undergraduate
509 Graduate
47 Online Students
Graduation Rate
24% Graduation Rate
45% Transfer-out Rate
80% Retention Rate
Faculty & Staff
14 to 1 Students to Faculty
240 Faculties (full-time)
566 Staffs (full-time)
$88,146 Faculty Salary
$57,880 Staff Salary
Learning Opportunities
ROTC
Study Abroad
Evening College
Teacher Certificate
Study Abroad
Evening College
Teacher Certificate
Campus Living
Campus Housing Offered
-$9,368 annual charge
-695 capacity
Add a College
Add a College
Add a College
More rivals of Marywood
- vs. Husson University
- vs. Point Loma Nazarene University
- vs. University of Mary Hardin-Baylor
- vs. Bryan College-Dayton
- vs. The University of Texas Rio Grande Valley
- vs. Russell Sage College
- vs. Southern University and A & M College
- vs. John Brown University
- vs. Xavier University of Louisiana
- vs. Clayton State University
- vs. Temple University
- vs. Champlain College
- vs. Southern Adventist University
- vs. Adelphi University
- vs. Oregon State University
More rivals of Penn State Harrisburg
- vs. Hussian College-Philadelphia
- vs. Lycoming College
- vs. United Lutheran Seminary
- vs. Missio Theological Seminary
- vs. Franklin and Marshall College
- vs. Westminster Theological Seminary
- vs. Wilson College
- vs. Yeshivath Beth Moshe
- vs. The Art Institutes of York-PA
- vs. EDMC Central Administrative Office
- vs. Central Penn College
- vs. Washington & Jefferson College
- vs. Pennsylvania State University-Penn State Beaver
- vs. The Art Institute of Pittsburgh-Online Division
- vs. Pennsylvania State University-Penn State Erie-Behrend College