
Millikin vs. Franklin W Olin College of Engineering
Millikin ranked #-1 and Franklin W Olin College of Engineering ranked #-1 in national university ranking. The following statements compare Millikin University and Franklin W Olin College of Engineering with important academic statistics including tuition, test scores, and admission rate.
- Both schools are private.
- Franklin W Olin College of Engineering's tuition ($63,742) is more expensive than Millikin ($26,792).
- Franklin W Olin College of Engineering's acceptance rate (25.20%) is lower than Millikin (66.68%).
- Franklin W Olin College of Engineering has higher yield (43.65%) than Millikin (9.97%).
- Franklin W Olin College of Engineering's SAT score (1,520) is higher than Millikin (1,020).
- Franklin W Olin College of Engineering's students to faculty ratio (9 to 1) is lower than Millikin (10 to 1).
- Millikin (1,586 students) is larger than Franklin W Olin College of Engineering (405 students) with more enrolled students.
- Franklin W Olin College of Engineering ($42,121) has higher amount of financial aid than Millikin ($31,416).
- Franklin W Olin College of Engineering's graduation rate (96%) is higher than Millikin (55%).

Offered Degrees
Certificate Programs
Bachelor's
Post-Graduate Certificate
Master's
Doctorate
Bachelor's
Post-Graduate Certificate
Master's
Doctorate
Tuition & Fees
$26,792
Financial Aid
$31,416
Test Scores
1,020 SAT
21 ACT
Admission
66.68% Acceptance Rate
9.97% Yield
Enrollment
1,495 Undergraduate
91 Graduate
66 Online Students
Graduation Rate
55% Graduation Rate
75% Retention Rate
Faculty & Staff
10 to 1 Students to Faculty
116 Faculties (full-time)
285 Staffs (full-time)
$59,076 Faculty Salary
$58,072 Staff Salary
Learning Opportunities
Study Abroad
Evening College
Teacher Certificate
Evening College
Teacher Certificate
Campus Living
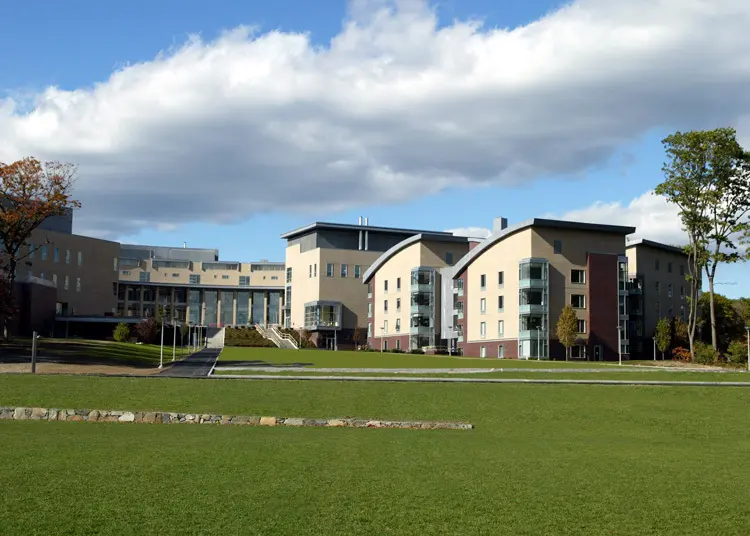
Offered Degrees
Bachelor's
Tuition & Fees
$63,742
Financial Aid
$42,121
Test Scores
1,520 SAT
Admission
25.20% Acceptance Rate
43.65% Yield
Enrollment
405 (All undergraduate)
Graduation Rate
96% Graduation Rate
98% Retention Rate
Faculty & Staff
9 to 1 Students to Faculty
47 Faculties (full-time)
121 Staffs (full-time)
$138,216 Faculty Salary
$110,531 Staff Salary
Learning Opportunities
Study Abroad
Campus Living
Add a College
Add a College
Add a College
More rivals of Millikin
- vs. Welch College
- vs. Millennia Atlantic University
- vs. South University-Montgomery
- vs. College of Southern Nevada
- vs. Trinity Valley Community College
- vs. Austin Community College District
- vs. University of the Potomac-VA Campus
- vs. Trine University
- vs. Center for Advanced Studies On Puerto Rico and the Caribbean
- vs. Pacific College of Health and Science
- vs. University of Pennsylvania
- vs. Sofia University
- vs. Bryant & Stratton College-Online
- vs. The Colleges of Law at Ventura
- vs. Voorhees University
More rivals of Franklin W Olin College of Engineering
- vs. Platt College-Los Angeles
- vs. Welch College
- vs. Northern New Mexico College
- vs. Clark State College
- vs. Marietta College
- vs. Kuyper College
- vs. Urbana Theological Seminary
- vs. Oklahoma Panhandle State University
- vs. Pacific College of Health and Science
- vs. Bridges Christian College
- vs. Polytechnic University of Puerto Rico-Miami
- vs. Pennsylvania College of Art and Design
- vs. Ohio State University-Mansfield Campus
- vs. University of Puerto Rico
- vs. Galen Health Institutes-Las Vegas