
Ohio State University-Lima Campus vs. UConn - Stamford
Ohio State University-Lima Campus ranked #-1 and UConn - Stamford ranked #-1 in national university ranking. The following statements compare Ohio State University-Lima Campus and University of Connecticut-Stamford with important academic statistics including tuition, test scores, and admission rate.
- Both schools are public.
- UConn - Stamford's tuition ($40,818) is more expensive than Ohio State University-Lima Campus ($36,266).
- UConn - Stamford's acceptance rate (82.98%) is lower than UConn - Stamford (82.98%).
- UConn - Stamford has higher yield (10.30%) than UConn - Stamford (10.30%).
- Both schools have same SAT scores of 1,080.
- Ohio State University-Lima Campus's students to faculty ratio (17 to 1) is lower than UConn - Stamford (21 to 1).
- UConn - Stamford (2,482 students) is larger than Ohio State University-Lima Campus (723 students) with more enrolled students.
- UConn - Stamford ($14,406) has higher amount of financial aid than Ohio State University-Lima Campus ($6,833).
- UConn - Stamford's graduation rate (57%) is higher than Ohio State University-Lima Campus (23%).

Offered Degrees
Associate
Bachelor's
Bachelor's
Tuition & Fees
$9,488 In-State
$36,266 out-of-state
$36,266 out-of-state
Financial Aid
$6,833
Test Scores
Admission
Enrollment
720 Undergraduate
3 Graduate
65 Online Students
Graduation Rate
23% Graduation Rate
51% Transfer-out Rate
42% Retention Rate
Faculty & Staff
17 to 1 Students to Faculty
25 Faculties (full-time)
77 Staffs (full-time)
$101,005 Faculty Salary
$57,281 Staff Salary
Learning Opportunities
Study Abroad
Evening College
Teacher Certificate
Evening College
Teacher Certificate
Campus Living
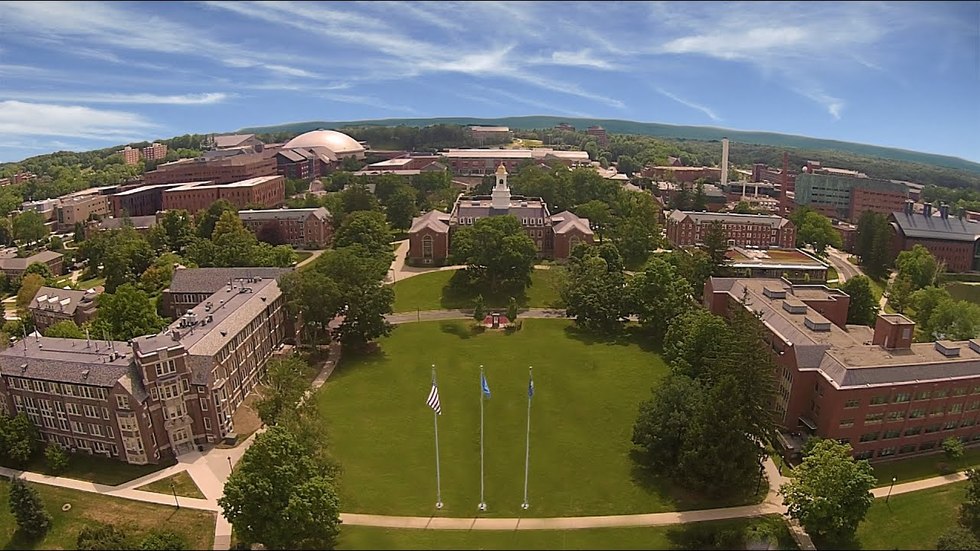
Offered Degrees
Associate
Bachelor's
Bachelor's
Tuition & Fees
$18,150 In-State
$40,818 out-of-state
$40,818 out-of-state
Financial Aid
$14,406
Test Scores
1,080 SAT
29 ACT
Admission
82.98% Acceptance Rate
10.30% Yield
Enrollment
2,482 (All undergraduate)
27 Online Students
Graduation Rate
57% Graduation Rate
18% Transfer-out Rate
82% Retention Rate
Faculty & Staff
21 to 1 Students to Faculty
Learning Opportunities
ROTC
Study Abroad
Teacher Certificate
Study Abroad
Teacher Certificate
Campus Living
Add a College
Add a College
Add a College
More rivals of Ohio State University-Lima Campus
- vs. Phoenix Seminary
- vs. Sherman College of Chiropractic
- vs. University of Puerto Rico-Mayaguez
- vs. Institute of Buddhist Studies
- vs. Hackensack Meridian School of Medicine
- vs. Pittsburgh Theological Seminary
- vs. Martinsburg College
- vs. Antioch University-System Administration
- vs. CUNY School of Law
- vs. Manna University
- vs. Yeshivath Zichron Moshe
- vs. Center for Advanced Legal Studies
- vs. New York Academy of Art
- vs. Bais Medrash Elyon
- vs. Professional University Dr. Carlos J. Borrero Rios
More rivals of UConn - Stamford
- vs. Las Vegas College
- vs. Daytona College
- vs. Huertas College
- vs. Benedictine College
- vs. Jamestown Business College
- vs. Cerritos College
- vs. Austin Community College District
- vs. University of Puerto Rico at Cayey
- vs. Relay Graduate School of Education
- vs. Upstate Medical University
- vs. Bethany Global University
- vs. Huntingdon College
- vs. Brigham Young University-Idaho
- vs. Herzing University-New Orleans
- vs. Universal Technology College of Puerto Rico