
Ohio University-Chillicothe Campus vs. Penn State Harrisburg
Ohio University-Chillicothe Campus ranked #-1 and Penn State Harrisburg ranked #-1 in national university ranking. The following statements compare Ohio University-Chillicothe Campus and Pennsylvania State University-Penn State Harrisburg with important academic statistics including tuition, test scores, and admission rate.
- Both schools are public.
- Penn State Harrisburg's tuition ($26,958) is more expensive than Ohio University-Chillicothe Campus ($9,444).
- Penn State Harrisburg's acceptance rate (97.60%) is lower than Penn State Harrisburg (97.60%).
- Penn State Harrisburg has higher yield (11.24%) than Penn State Harrisburg (11.24%).
- Both schools have same SAT scores of 1,220.
- Penn State Harrisburg's students to faculty ratio (15 to 1) is lower than Ohio University-Chillicothe Campus (17 to 1).
- Penn State Harrisburg (4,478 students) is larger than Ohio University-Chillicothe Campus (2,170 students) with more enrolled students.
- Penn State Harrisburg ($10,737) has higher amount of financial aid than Ohio University-Chillicothe Campus ($5,796).
- Penn State Harrisburg's graduation rate (26%) is higher than Ohio University-Chillicothe Campus (14%).

Offered Degrees
Certificate Programs
Associate
Bachelor's
Associate
Bachelor's
Tuition & Fees
$6,362 In-State
$9,444 out-of-state
$9,444 out-of-state
Financial Aid
$5,796
Test Scores
Admission
Enrollment
2,170 (All undergraduate)
577 Online Students
Graduation Rate
14% Graduation Rate
4% Transfer-out Rate
67% Retention Rate
Faculty & Staff
17 to 1 Students to Faculty
31 Faculties (full-time)
50 Staffs (full-time)
$71,466 Faculty Salary
$73,628 Staff Salary
Learning Opportunities
Evening College
Campus Living
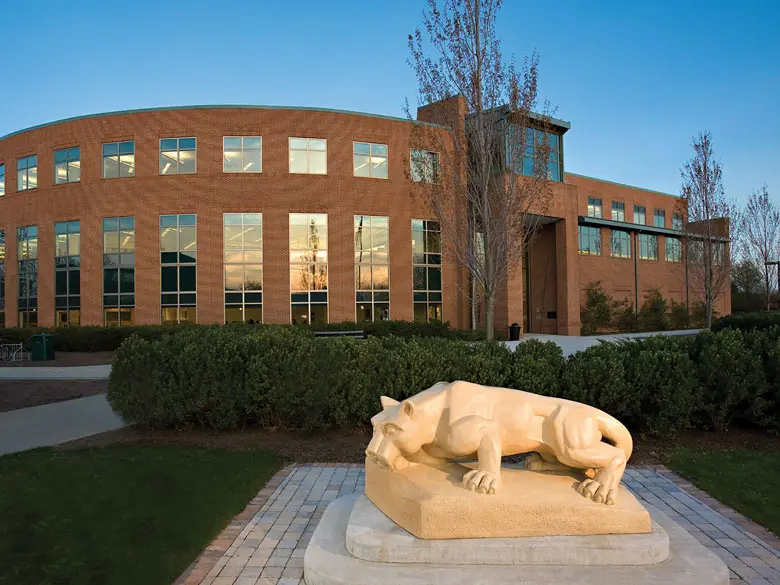
Offered Degrees
Certificate Programs
Associate
Bachelor's
Post-Graduate Certificate
Master's
Doctorate
Associate
Bachelor's
Post-Graduate Certificate
Master's
Doctorate
Tuition & Fees
$15,972 In-State
$26,958 out-of-state
$26,958 out-of-state
Financial Aid
$10,737
Test Scores
1,220 SAT
27 ACT
Admission
97.60% Acceptance Rate
11.24% Yield
Enrollment
4,047 Undergraduate
431 Graduate
66 Online Students
Graduation Rate
26% Graduation Rate
82% Retention Rate
Faculty & Staff
15 to 1 Students to Faculty
246 Faculties (full-time)
569 Staffs (full-time)
$100,145 Faculty Salary
$70,475 Staff Salary
Learning Opportunities
ROTC
Study Abroad
Evening College
Teacher Certificate
Study Abroad
Evening College
Teacher Certificate
Campus Living
Add a College
Add a College
Add a College
More rivals of Ohio University-Chillicothe Campus
- vs. Reach University
- vs. Inter American University of Puerto Rico-Fajardo
- vs. Lamar Community College
- vs. Sacred Heart Seminary and School of Theology
- vs. Northland College
- vs. Elim Bible College
- vs. Hackensack Meridian School of Medicine
- vs. Wisconsin School of Professional Psychology
- vs. Jung Tao School of Classical Chinese Medicine
- vs. Yeshiva Shaar Ephraim
- vs. Arizona College of Nursing-Salt Lake City
- vs. A T Still University of Health Sciences
- vs. Yeshiva Gedolah Shaarei Shmuel
- vs. Chamberlain University-Nevada
- vs. Eden Theological Seminary
More rivals of Penn State Harrisburg
- vs. The North Coast College
- vs. Solano Community College
- vs. HCI College
- vs. Rabbinical Seminary Mkor Chaim
- vs. Associated Beth Rivkah Schools
- vs. Renton Technical College
- vs. University of Phoenix-Texas
- vs. California Miramar University
- vs. Arizona College of Nursing-Cleveland
- vs. Simpson College
- vs. San Joaquin College of Law
- vs. Bryan College of Health Sciences
- vs. American College of Healthcare Sciences
- vs. Southern California University of Health Sciences
- vs. Paul Smiths College of Arts and Science