
Compare Pacific College of Health and Science and University of Connecticut-Hartford Campus
Pacific College of Health and Science ranked #-1 and UConn - Hartford ranked #-1 in national university ranking. The following statements compare Pacific College of Health and Science and University of Connecticut-Hartford Campus with important academic statistics including tuition, test scores, and admission rate.
- UConn - Hartford's tuition ($40,798) is more expensive than Pacific College of Health and Science ($7,508).
- UConn - Hartford's acceptance rate (88.33%) is lower than UConn - Hartford (88.33%).
- UConn - Hartford has higher yield (22.40%) than UConn - Hartford (22.40%).
- Both schools have same SAT scores of 1,070.
- Pacific College of Health and Science's students to faculty ratio (12 to 1) is lower than UConn - Hartford (26 to 1).
- UConn - Hartford (1,544 students) is larger than Pacific College of Health and Science (245 students) with more enrolled students.
- UConn - Hartford ($14,402) has higher amount of financial aid than Pacific College of Health and Science ($1,074).
- Pacific College of Health and Science's graduation rate (78%) is higher than UConn - Hartford (65%).
Add More College

Pacific College of Health and Science
Private, 4 years • Chicago, ILOffered Degrees
Certificate Programs
Associate
Master's
Post-Graduate Certificate
Doctorate
Associate
Master's
Post-Graduate Certificate
Doctorate
Tuition & Fees
$7,508
Financial Aid
$1,074
Test Scores
Admission
Enrollment
60 Undergraduate
185 Graduate
64 Online Students
Graduation Rate
78% Graduation Rate
Faculty & Staff
12 to 1 Students to Faculty
3 Faculties (full-time)
13 Staffs (full-time)
$39,000 Faculty Salary
$62,825 Staff Salary
Learning Opportunities
Evening College
Campus Living
Remove School
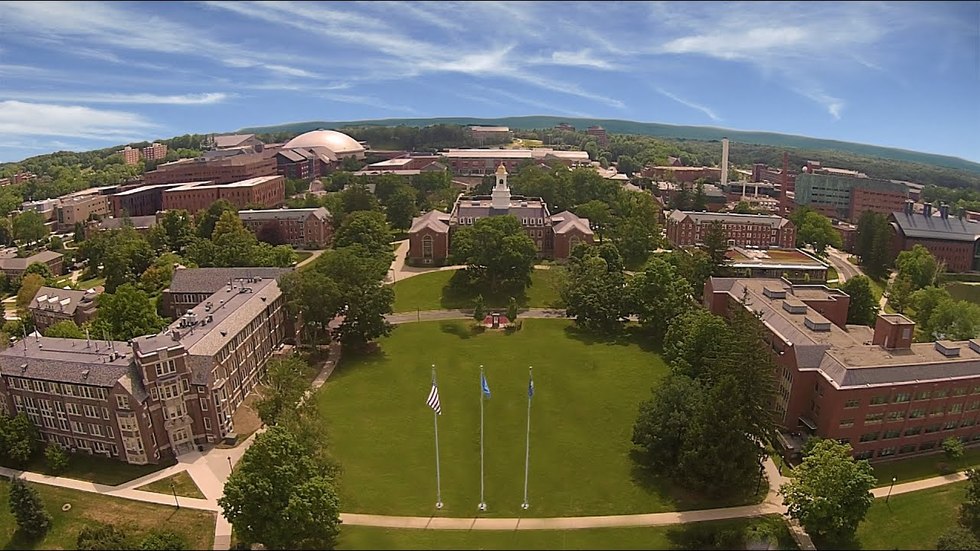
University of Connecticut-Hartford Campus
Public, 4 years • Hartford, CTOffered Degrees
Associate
Bachelor's
Bachelor's
Tuition & Fees
$18,130 In-State
$40,798 out-of-state
$40,798 out-of-state
Financial Aid
$14,402
Test Scores
1,070 SAT
23 ACT
Admission
88.33% Acceptance Rate
22.40% Yield
Enrollment
1,544 (All undergraduate)
21 Online Students
Graduation Rate
65% Graduation Rate
17% Transfer-out Rate
84% Retention Rate
Faculty & Staff
26 to 1 Students to Faculty
Learning Opportunities
ROTC
Study Abroad
Teacher Certificate
Study Abroad
Teacher Certificate
Campus Living
Remove School
Add a College
Add a College
Add a College
More rivals of Pacific College of Health and Science
- vs. Ensign College
- vs. Appalachian School of Law
- vs. Sacred Heart Seminary and School of Theology
- vs. Acupuncture and Massage College
- vs. William James College
- vs. University of Hawaii System Office
- vs. Miller-Motte College-Chattanooga
- vs. Santa Monica College
- vs. James A. Rhodes State College
- vs. Austin Community College District
- vs. Columbia Central University-Caguas
- vs. Bryant & Stratton College-Online
- vs. Montana Bible College
- vs. SUNY College of Technology at Alfred
- vs. Louisiana State University at Alexandria
More rivals of UConn - Hartford
- vs. University of Toccoa Falls
- vs. Ohio University-Lancaster Campus
- vs. Louisiana State University Health Sciences Center-New Orleans
- vs. Bolivar Technical College
- vs. University of Pittsburgh-Bradford
- vs. University of Cincinnati-Clermont College
- vs. Hesston College
- vs. University of Akron Wayne College
- vs. Remington College-Shreveport Campus
- vs. Beth Medrash Meor Yitzchok
- vs. American Film Institute Conservatory
- vs. Montana Bible College
- vs. Eastern International College-Jersey City
- vs. Smith Chason College
- vs. Pope St John XXIII National Seminary