
Southern California University of Health Sciences vs. Loyola Marymount
Both Southern California University of Health Sciences and Loyola Marymount University are Private, 4 years schools located in California. The following statements compare Southern California University of Health Sciences and Loyola Marymount University with important academic statistics including tuition, test scores, and admission rate.
- Both schools are private.
- Loyola Marymount's tuition ($61,867) is more expensive than Southern California University of Health Sciences ($14,390).
- Loyola Marymount's acceptance rate (45.08%) is lower than Loyola Marymount (45.08%).
- Loyola Marymount has higher yield (14.80%) than Loyola Marymount (14.80%).
- Both schools have same SAT scores of 1,350.
- Loyola Marymount's students to faculty ratio (10 to 1) is lower than Southern California University of Health Sciences (14 to 1).
- Loyola Marymount (10,179 students) is larger than Southern California University of Health Sciences (2,008 students) with more enrolled students.
- Loyola Marymount ($24,107) has higher amount of financial aid than Southern California University of Health Sciences ($6,053).
- Loyola Marymount's graduation rate (79%) is higher than Southern California University of Health Sciences (50%).

Offered Degrees
Certificate Programs
Bachelor's
Post-Graduate Certificate
Master's
Doctorate
Bachelor's
Post-Graduate Certificate
Master's
Doctorate
Tuition & Fees
$14,390
Financial Aid
$6,053
Test Scores
Admission
Enrollment
729 Undergraduate
1,279 Graduate
1,069 Online Students
Graduation Rate
50% Graduation Rate
Faculty & Staff
14 to 1 Students to Faculty
48 Faculties (full-time)
183 Staffs (full-time)
$81,427 Faculty Salary
$107,954 Staff Salary
Learning Opportunities
Study Abroad
Evening College
Evening College
Campus Living
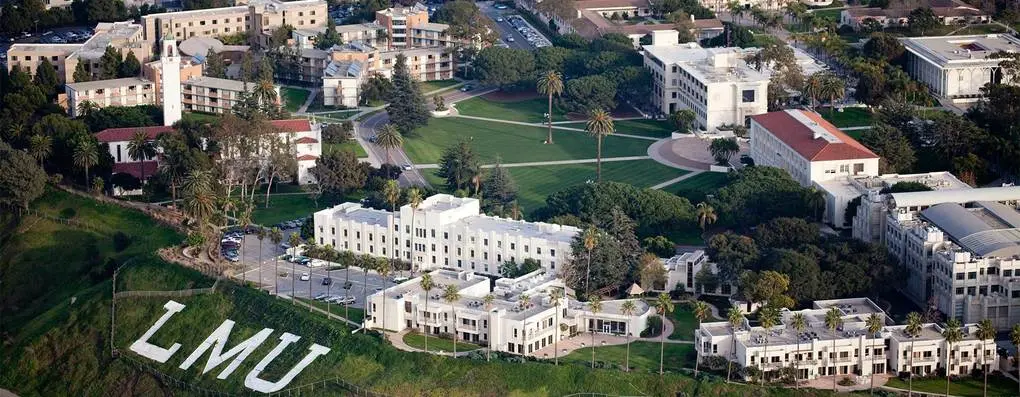
Loyola Marymount University
Private, 4 years • Los Angeles, CA #75 National Universities, #18 in California more rivalsOffered Degrees
Bachelor's
Post-Graduate Certificate
Master's
Doctorate
Post-Graduate Certificate
Master's
Doctorate
Tuition & Fees
$61,867
Financial Aid
$24,107
Test Scores
1,350 SAT
30 ACT
Admission
45.08% Acceptance Rate
14.80% Yield
Enrollment
7,273 Undergraduate
2,906 Graduate
568 Online Students
Graduation Rate
79% Graduation Rate
89% Retention Rate
Faculty & Staff
10 to 1 Students to Faculty
644 Faculties (full-time)
2,007 Staffs (full-time)
$123,996 Faculty Salary
$93,194 Staff Salary
Learning Opportunities
ROTC
Study Abroad
Evening College
Teacher Certificate
Study Abroad
Evening College
Teacher Certificate
Campus Living
Add a College
Add a College
Add a College
More rivals of Southern California University of Health Sciences
- vs. California Baptist University
- vs. Otis College of Art and Design
- vs. Cal Northern School of Law
- vs. Whittier College
- vs. Westcliff University
- vs. American Conservatory Theater
- vs. Haven University
- vs. California Prestige University
- vs. Pacific Union College
- vs. University of California-Riverside
- vs. University of San Francisco
- vs. Academy of Art University
- vs. Southwestern Law School
- vs. PCI College
- vs. DeVry University-California
More rivals of Loyola Marymount
- vs. Rochester Institute of Technology
- vs. Marquette University
- vs. Fairfield University
- vs. Southern Methodist University
- vs. University of California-Santa Barbara
- vs. University of Illinois Chicago
- vs. University of Washington-Seattle Campus
- vs. University of Washington-Bothell Campus
- vs. Bryn Mawr College
- vs. Scripps College
- vs. Virginia Polytechnic Institute and State University
- vs. Saint Louis University
- vs. SUNY Maritime College
- vs. Texas A&M University-College Station
- vs. California Polytechnic State University-San Luis Obispo