
UT Health San Antonio vs. Oregon State University-Cascades Campus
UT Health San Antonio ranked #-1 and Oregon State University-Cascades Campus ranked #-1 in national university ranking. The following statements compare The University of Texas Health Science Center at San Antonio and Oregon State University-Cascades Campus with important academic statistics including tuition, test scores, and admission rate.
- Both schools are public.
- Oregon State University-Cascades Campus's tuition ($37,356) is more expensive than UT Health San Antonio ($27,776).
- Oregon State University-Cascades Campus's acceptance rate (63.11%) is lower than Oregon State University-Cascades Campus (63.11%).
- Oregon State University-Cascades Campus has higher yield (13.80%) than Oregon State University-Cascades Campus (13.80%).
- Both schools have same SAT scores of 1,255.
- UT Health San Antonio's students to faculty ratio (6 to 1) is lower than Oregon State University-Cascades Campus (9 to 1).
- UT Health San Antonio (3,786 students) is larger than Oregon State University-Cascades Campus (1,296 students) with more enrolled students.
- Oregon State University-Cascades Campus ($10,117) has higher amount of financial aid than UT Health San Antonio ($5,863).
- Both schools have same graduation rate of 56%.
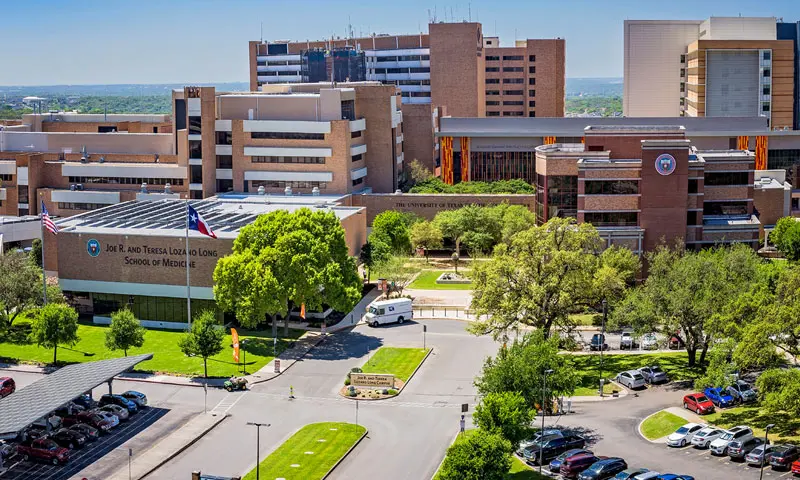
The University of Texas Health Science Center at San Antonio
Public, 4 years • San Antonio, TX more rivalsOffered Degrees
Certificate Programs
Bachelor's
Post-Graduate Certificate
Master's
Doctorate
Bachelor's
Post-Graduate Certificate
Master's
Doctorate
Tuition & Fees
$10,991 In-State
$27,776 out-of-state
$27,776 out-of-state
Financial Aid
$5,863
Test Scores
Admission
Enrollment
930 Undergraduate
2,856 Graduate
132 Online Students
Graduation Rate
Faculty & Staff
6 to 1 Students to Faculty
868 Faculties (full-time)
6,374 Staffs (full-time)
$105,204 Faculty Salary
$73,733 Staff Salary
Learning Opportunities
Campus Living

Offered Degrees
Certificate Programs
Bachelor's
Post-Graduate Certificate
Master's
Doctorate
Bachelor's
Post-Graduate Certificate
Master's
Doctorate
Tuition & Fees
$13,566 In-State
$37,356 out-of-state
$37,356 out-of-state
Financial Aid
$10,117
Test Scores
1,255 SAT
Admission
63.11% Acceptance Rate
13.80% Yield
Enrollment
1,049 Undergraduate
247 Graduate
Graduation Rate
56% Graduation Rate
22% Transfer-out Rate
75% Retention Rate
Faculty & Staff
9 to 1 Students to Faculty
Learning Opportunities
ROTC
Study Abroad
Teacher Certificate
Study Abroad
Teacher Certificate
Campus Living
Add a College
Add a College
Add a College
More rivals of UT Health San Antonio
- vs. South Florida Bible College and Theological Seminary
- vs. Northwest College of Art & Design
- vs. Bryant & Stratton College-Buffalo
- vs. Lake Erie College of Osteopathic Medicine
- vs. Talmudical Seminary Oholei Torah
- vs. Wisconsin Lutheran College
- vs. Lake Washington Institute of Technology
- vs. Dickinson State University
- vs. Miami University-Hamilton
- vs. American Academy of Art College
- vs. Stillman College
- vs. Charter College
- vs. University of Maine-System Central Office
- vs. Brazosport College
- vs. Rabbi Jacob Joseph School
More rivals of Oregon State University-Cascades Campus
- vs. Yeshivath Viznitz
- vs. Pontifical Catholic University of Puerto Rico-Mayaguez
- vs. United States Sports University
- vs. Pentecostal Theological Seminary
- vs. Talmudical Yeshiva of Philadelphia
- vs. HJ International Graduate School for Peace and Public Leadership
- vs. Rocky Mountain University of Health Professions
- vs. Rochester Christian University
- vs. Oak Hills Christian College
- vs. Puerto Rico Conservatory of Music
- vs. The University of Texas Health Science Center at Houston
- vs. Albany Medical College
- vs. Great Lakes Christian College
- vs. Pennsylvania State University-Penn State DuBois
- vs. Maine College of Art & Design