
William Penn vs. Albany College of Pharmacy and Health Sciences
William Penn ranked #-1 and Albany College of Pharmacy and Health Sciences ranked #-1 in national university ranking. The following statements compare William Penn University and Albany College of Pharmacy and Health Sciences with important academic statistics including tuition, test scores, and admission rate.
- Both schools are private.
- Albany College of Pharmacy and Health Sciences's tuition ($41,125) is more expensive than William Penn ($29,750).
- William Penn's acceptance rate (51.88%) is lower than Albany College of Pharmacy and Health Sciences (52.69%).
- William Penn has higher yield (41.95%) than Albany College of Pharmacy and Health Sciences (6.65%).
- Albany College of Pharmacy and Health Sciences's SAT score (1,240) is higher than William Penn (990).
- Albany College of Pharmacy and Health Sciences's students to faculty ratio (10 to 1) is lower than William Penn (15 to 1).
- William Penn (1,425 students) is larger than Albany College of Pharmacy and Health Sciences (908 students) with more enrolled students.
- Albany College of Pharmacy and Health Sciences ($22,588) has higher amount of financial aid than William Penn ($19,776).
- Albany College of Pharmacy and Health Sciences's graduation rate (68%) is higher than William Penn (33%).
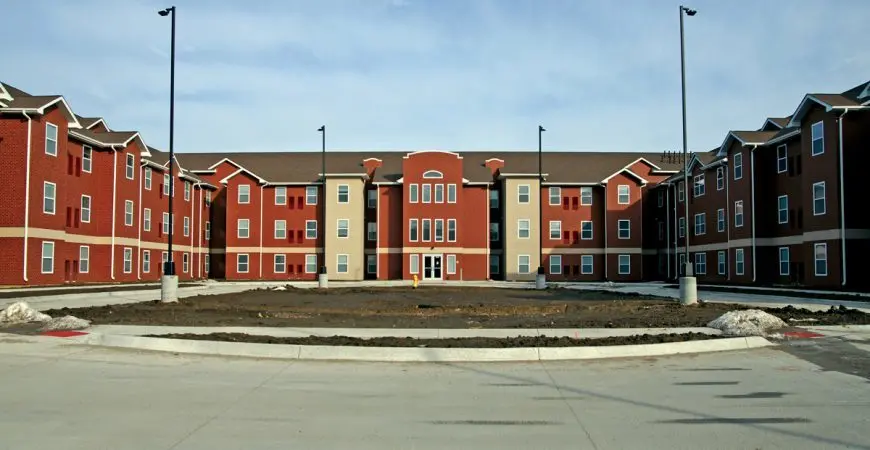
Offered Degrees
Certificate Programs
Bachelor's
Master's
Bachelor's
Master's
Tuition & Fees
$29,750
Financial Aid
$19,776
Test Scores
990 SAT
18 ACT
Admission
51.88% Acceptance Rate
41.95% Yield
Enrollment
1,348 Undergraduate
77 Graduate
226 Online Students
Graduation Rate
33% Graduation Rate
58% Retention Rate
Faculty & Staff
15 to 1 Students to Faculty
46 Faculties (full-time)
150 Staffs (full-time)
$57,545 Faculty Salary
$56,070 Staff Salary
Learning Opportunities
Evening College
Teacher Certificate
Teacher Certificate
Campus Living
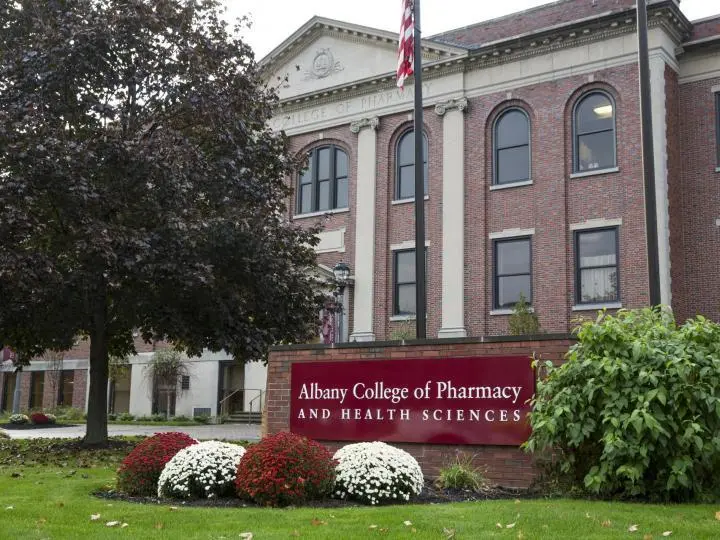
Offered Degrees
Bachelor's
Master's
Doctorate
Master's
Doctorate
Tuition & Fees
$41,125
Financial Aid
$22,588
Test Scores
1,240 SAT
28 ACT
Admission
52.69% Acceptance Rate
6.65% Yield
Enrollment
533 Undergraduate
375 Graduate
5 Online Students
Graduation Rate
68% Graduation Rate
18% Transfer-out Rate
86% Retention Rate
Faculty & Staff
10 to 1 Students to Faculty
71 Faculties (full-time)
198 Staffs (full-time)
$90,579 Faculty Salary
$75,813 Staff Salary
Learning Opportunities
ROTC
Study Abroad
Study Abroad
Campus Living
Add a College
Add a College
Add a College
More rivals of William Penn
- vs. United International College
- vs. Reinhardt University
- vs. Yeshiva Zichron Aryeh
- vs. City College-Hollywood
- vs. Relay Graduate School of Education
- vs. Fort Lewis College
- vs. Pueblo Community College
- vs. Loras College
- vs. Allen College
- vs. Embry-Riddle Aeronautical University-Prescott
- vs. Yeshiva Yesoda Hatorah Vetz Chaim
- vs. Charleston School of Law
- vs. California Northstate University
- vs. College of Eastern Idaho
- vs. Emperor's College of Traditional Oriental Medicine
More rivals of Albany College of Pharmacy and Health Sciences
- vs. SUNY Downstate Health Sciences University
- vs. Design Institute of San Diego
- vs. Whitworth University-Adult Degree Programs
- vs. Sh'or Yoshuv Rabbinical College
- vs. Community College of Denver
- vs. Central Penn College
- vs. Franciscan Missionaries of Our Lady University
- vs. Arizona College of Nursing-Las Vegas
- vs. Arizona College of Nursing-Sarasota
- vs. Dean College
- vs. University of Pittsburgh-Bradford
- vs. South Texas College of Law Houston
- vs. Bacone College
- vs. Interdenominational Theological Center
- vs. Santa Monica College