
Hussian College-Philadelphia vs. Slippery Rock University of Pennsylvania
Both Hussian College-Philadelphia and Slippery Rock University of Pennsylvania are 4 years schools located in Pennsylvania. The following statements compare Hussian College-Philadelphia and Slippery Rock University of Pennsylvania with important academic statistics including tuition, test scores, and admission rate.
- Hussian College-Philadelphia's tuition ($22,225) is more expensive than Slippery Rock University of Pennsylvania ($14,676).
- Slippery Rock University of Pennsylvania's acceptance rate (71.47%) is lower than Slippery Rock University of Pennsylvania (71.47%).
- Slippery Rock University of Pennsylvania has higher yield (33.51%) than Slippery Rock University of Pennsylvania (33.51%).
- Both schools have same SAT scores of 1,090.
- Hussian College-Philadelphia's students to faculty ratio (16 to 1) is lower than Slippery Rock University of Pennsylvania (20 to 1).
- Slippery Rock University of Pennsylvania (8,376 students) is larger than Hussian College-Philadelphia (80 students) with more enrolled students.
- Hussian College-Philadelphia ($12,941) has higher amount of financial aid than Slippery Rock University of Pennsylvania ($7,184).
- Slippery Rock University of Pennsylvania's graduation rate (66%) is higher than Hussian College-Philadelphia (40%).

Offered Degrees
Tuition & Fees
$22,225
Financial Aid
$12,941
Test Scores
Admission
Enrollment
80 (All undergraduate)
Graduation Rate
40% Graduation Rate
90% Retention Rate
Faculty & Staff
16 to 1 Students to Faculty
9 Staffs (full-time)
$85,575 Faculty Salary
$68,000 Staff Salary
Learning Opportunities
Campus Living
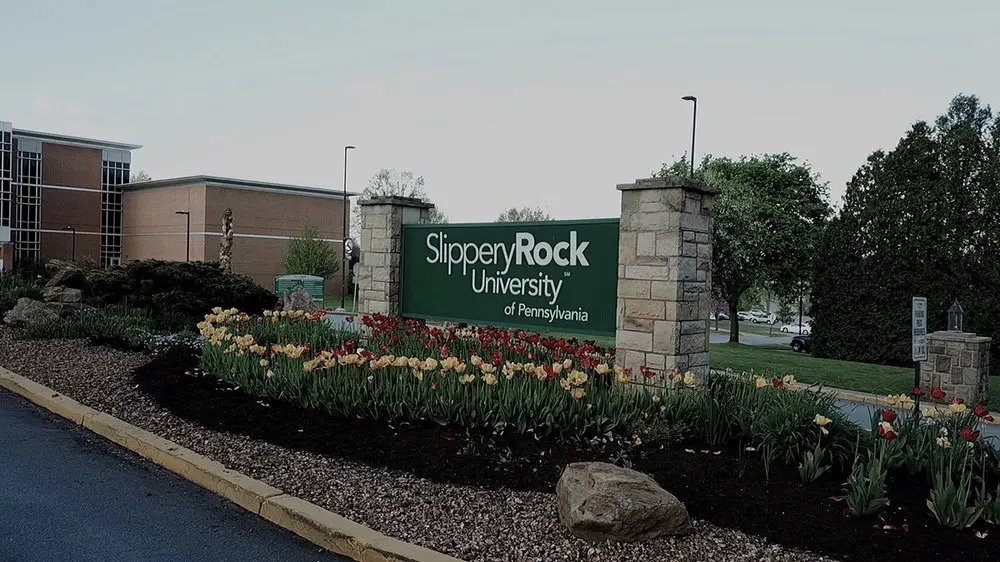
Slippery Rock University of Pennsylvania
Public, 4 years • Slippery Rock, PA #39 in Pennsylvania more rivalsOffered Degrees
Certificate Programs
Bachelor's
Post-Graduate Certificate
Master's
Doctorate
Bachelor's
Post-Graduate Certificate
Master's
Doctorate
Tuition & Fees
$10,568 In-State
$14,676 out-of-state
$14,676 out-of-state
Financial Aid
$7,184
Test Scores
1,090 SAT
22 ACT
Admission
71.47% Acceptance Rate
33.51% Yield
Enrollment
6,835 Undergraduate
1,541 Graduate
1,273 Online Students
Graduation Rate
66% Graduation Rate
18% Transfer-out Rate
84% Retention Rate
Faculty & Staff
20 to 1 Students to Faculty
360 Faculties (full-time)
859 Staffs (full-time)
$99,158 Faculty Salary
$66,559 Staff Salary
Learning Opportunities
ROTC
Study Abroad
Evening College
Teacher Certificate
Study Abroad
Evening College
Teacher Certificate
Campus Living
Add a College
Add a College
Add a College
More rivals of Hussian College-Philadelphia
- vs. Mount Aloysius College
- vs. Ursinus College
- vs. University of Pittsburgh-Greensburg
- vs. Pennsylvania State University-Penn State Fayette- Eberly
- vs. King's College
- vs. Juniata College
- vs. Pennsylvania State University-Penn State York
- vs. Strayer University-Allentown Campus
- vs. Strayer University-Pennsylvania
- vs. Pennsylvania College of Technology
- vs. Gwynedd Mercy University
- vs. Allegheny College
- vs. Lake Erie College of Osteopathic Medicine
- vs. Pennsylvania State University-Penn State Greater Allegheny
- vs. United Lutheran Seminary
More rivals of Slippery Rock University of Pennsylvania
- vs. Commonwealth University of Pennsylvania
- vs. West Chester University of Pennsylvania
- vs. Shippensburg University of Pennsylvania
- vs. East Stroudsburg University of Pennsylvania
- vs. Seton Hill University
- vs. Kutztown University of Pennsylvania
- vs. Pennsylvania Western University
- vs. Gannon University
- vs. Millersville University of Pennsylvania
- vs. Indiana University of Pennsylvania
- vs. Shepherd University