
Loyola Marymount University vs. Pepperdine University
Both Loyola Marymount University and Pepperdine University are Private, 4 years schools located in California. The following statements compare Loyola Marymount University and Pepperdine University with important academic statistics including tuition, test scores, and admission rate.
- Both schools are private.
- Pepperdine's tuition ($69,918) is more expensive than Loyola Marymount ($61,867).
- Loyola Marymount's acceptance rate (45.08%) is lower than Pepperdine (62.86%).
- Loyola Marymount has higher yield (14.80%) than Pepperdine (11.64%).
- Pepperdine's SAT score (1,370) is higher than Loyola Marymount (1,350).
- Loyola Marymount's students to faculty ratio (10 to 1) is lower than Pepperdine (12 to 1).
- Loyola Marymount (10,179 students) is larger than Pepperdine (8,976 students) with more enrolled students.
- Pepperdine ($34,751) has higher amount of financial aid than Loyola Marymount ($24,107).
- Pepperdine's graduation rate (83%) is higher than Loyola Marymount (79%).
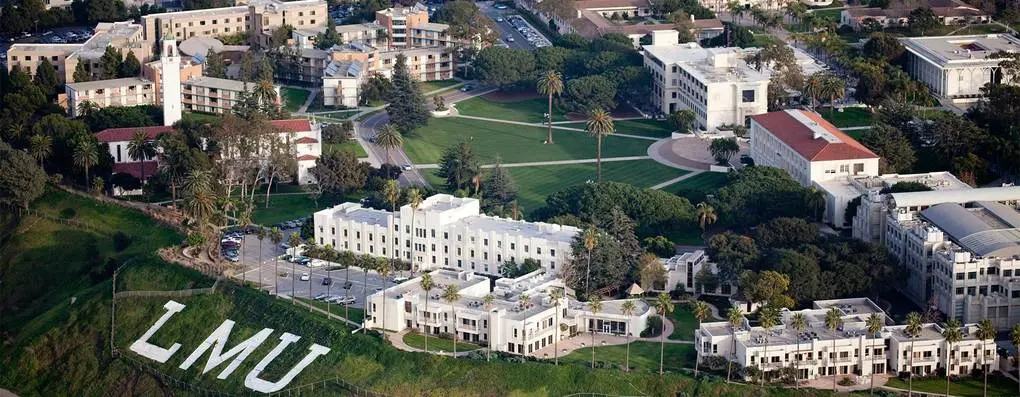
Loyola Marymount University
Private, 4 years • Los Angeles, CA #75 National Universities, #18 in California more rivalsOffered Degrees
Bachelor's
Post-Graduate Certificate
Master's
Doctorate
Post-Graduate Certificate
Master's
Doctorate
Tuition & Fees
$61,867
Financial Aid
$24,107
Test Scores
1,350 SAT
30 ACT
Admission
45.08% Acceptance Rate
14.80% Yield
Enrollment
7,273 Undergraduate
2,906 Graduate
568 Online Students
Graduation Rate
79% Graduation Rate
89% Retention Rate
Faculty & Staff
10 to 1 Students to Faculty
644 Faculties (full-time)
2,007 Staffs (full-time)
$123,996 Faculty Salary
$93,194 Staff Salary
Learning Opportunities
ROTC
Study Abroad
Evening College
Teacher Certificate
Study Abroad
Evening College
Teacher Certificate
Campus Living

Pepperdine University
Private, 4 years • Malibu, CA #52 National Universities, #12 in California more rivalsOffered Degrees
Certificate Programs
Bachelor's
Post-Graduate Certificate
Master's
Doctorate
Bachelor's
Post-Graduate Certificate
Master's
Doctorate
Tuition & Fees
$69,918
Financial Aid
$34,751
Test Scores
1,370 SAT
31 ACT
Admission
62.86% Acceptance Rate
11.64% Yield
Enrollment
3,553 Undergraduate
5,423 Graduate
2,486 Online Students
Graduation Rate
83% Graduation Rate
88% Retention Rate
Faculty & Staff
12 to 1 Students to Faculty
402 Faculties (full-time)
1,628 Staffs (full-time)
$128,828 Faculty Salary
$91,257 Staff Salary
Learning Opportunities
ROTC
Study Abroad
Evening College
Teacher Certificate
Study Abroad
Evening College
Teacher Certificate
Campus Living
Add a College
Add a College
Add a College
More rivals of Loyola Marymount
- vs. Bucknell University
- vs. Loma Linda University
- vs. Colorado School of Mines
- vs. University of the Pacific
- vs. University of Richmond
- vs. University of Maryland-College Park
- vs. Wesleyan University
- vs. Yeshiva University
- vs. Carleton College
- vs. Vassar College
- vs. Rensselaer Polytechnic Institute
- vs. University of Wisconsin-Madison
- vs. University of Illinois Urbana-Champaign
- vs. Drexel University
- vs. Bentley University
More rivals of Pepperdine
- vs. Loma Linda University
- vs. Colorado School of Mines
- vs. Wesleyan University
- vs. University of Illinois Urbana-Champaign
- vs. Grinnell College
- vs. Bentley University
- vs. Rensselaer Polytechnic Institute
- vs. Loyola Marymount University
- vs. University of Wisconsin-Madison
- vs. Illinois Institute of Technology
- vs. University of Maryland-College Park
- vs. Rutgers University-New Brunswick
- vs. Bucknell University
- vs. University of Rochester
- vs. Vassar College