
MIT vs. Commonwealth University of Pennsylvania
MIT ranked #1 and Commonwealth University of Pennsylvania ranked #-1 in national university ranking. The following statements compare Massachusetts Institute of Technology and Commonwealth University of Pennsylvania with important academic statistics including tuition, test scores, and admission rate.
- MIT's tuition ($62,396) is more expensive than Commonwealth University of Pennsylvania ($22,870).
- MIT's acceptance rate (4.55%) is lower than Commonwealth University of Pennsylvania (93.09%).
- MIT has higher yield (85.83%) than Commonwealth University of Pennsylvania (29.17%).
- MIT's SAT score (1,560) is higher than Commonwealth University of Pennsylvania (1,090).
- MIT's students to faculty ratio (3 to 1) is lower than Commonwealth University of Pennsylvania (19 to 1).
- MIT (11,886 students) is larger than Commonwealth University of Pennsylvania (11,092 students) with more enrolled students.
- MIT ($58,429) has higher amount of financial aid than Commonwealth University of Pennsylvania ($8,075).
- MIT's graduation rate (96%) is higher than Commonwealth University of Pennsylvania (54%).
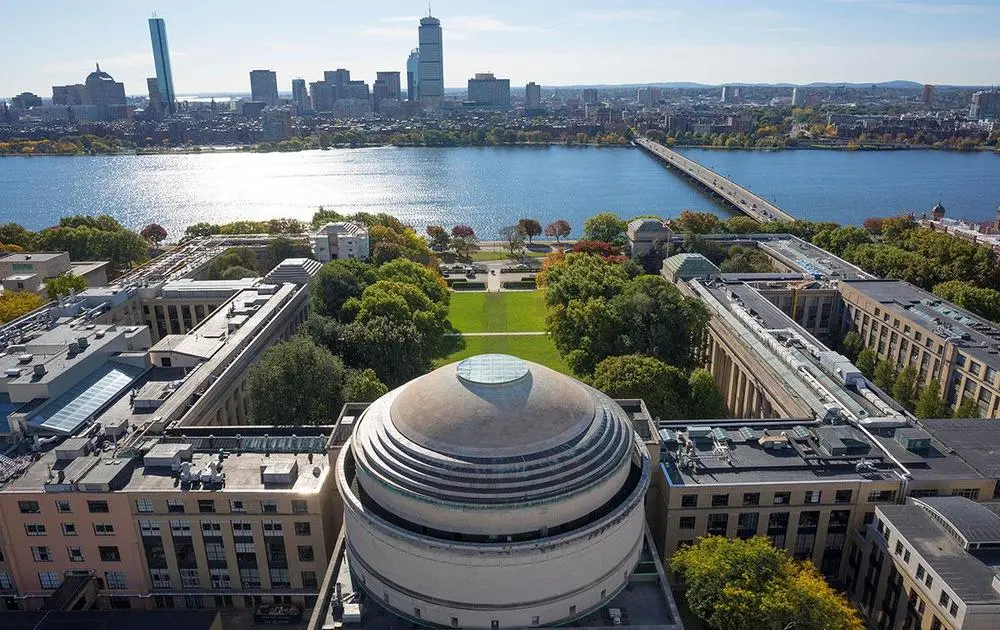
Massachusetts Institute of Technology
Private, 4 years • Cambridge, MA #1 National Universities, #1 in Massachusetts more rivalsOffered Degrees
Bachelor's
Master's
Doctorate
Master's
Doctorate
Tuition & Fees
$62,396
Financial Aid
$58,429
Test Scores
1,560 SAT
35 ACT
Admission
4.55% Acceptance Rate
85.83% Yield
Enrollment
4,535 Undergraduate
7,351 Graduate
46 Online Students
Graduation Rate
96% Graduation Rate
99% Retention Rate
Faculty & Staff
3 to 1 Students to Faculty
1,391 Faculties (full-time)
13,794 Staffs (full-time)
$221,399 Faculty Salary
$119,024 Staff Salary
Learning Opportunities
ROTC
Study Abroad
Teacher Certificate
Study Abroad
Teacher Certificate
Campus Living

Offered Degrees
Certificate Programs
Associate
Bachelor's
Post-Graduate Certificate
Master's
Doctorate
Associate
Bachelor's
Post-Graduate Certificate
Master's
Doctorate
Tuition & Fees
$11,046 In-State
$22,870 out-of-state
$22,870 out-of-state
Financial Aid
$8,075
Test Scores
1,090 SAT
Admission
93.09% Acceptance Rate
29.17% Yield
Enrollment
9,847 Undergraduate
1,245 Graduate
1,378 Online Students
Graduation Rate
54% Graduation Rate
1% Transfer-out Rate
78% Retention Rate
Faculty & Staff
19 to 1 Students to Faculty
508 Faculties (full-time)
1,376 Staffs (full-time)
$105,664 Faculty Salary
$67,193 Staff Salary
Learning Opportunities
ROTC
Study Abroad
Teacher Certificate
Study Abroad
Teacher Certificate
Campus Living
Add a College
Add a College
Add a College
More rivals of MIT
- vs. Yo San University of Traditional Chinese Medicine
- vs. Agape College of Business and Science
- vs. Ozark Christian College
- vs. Morris Brown College
- vs. Salus University
- vs. California Aeronautical University
- vs. Gurnick Academy of Medical Arts
- vs. Southeastern Baptist College
- vs. San Diego Community College District-District Office
- vs. Blessing Rieman College of Nursing and Health Sciences
- vs. Compu-Med Vocational Careers Corp
- vs. Columbia Theological Seminary
- vs. Fond du Lac Tribal and Community College
- vs. Life Pacific University
- vs. Westminster Theological Seminary
More rivals of Commonwealth University of Pennsylvania
- vs. The University of Texas Medical Branch at Galveston
- vs. Heritage Christian University
- vs. Pikes Peak State College
- vs. Chamberlain University-Indiana
- vs. Thomas Jefferson School of Law
- vs. Faith Baptist Bible College and Theological Seminary
- vs. Cleveland Institute of Art
- vs. Bowling Green State University-Firelands
- vs. University of South Carolina Beaufort
- vs. Curtis Institute of Music
- vs. South Puget Sound Community College
- vs. Massachusetts Institute of Technology
- vs. Mechon L'hoyroa
- vs. Torah Temimah Talmudical Seminary
- vs. Ohio University-Zanesville Campus