Graduate Schools at UCSB
University of California-Santa Barbara is a Public, 4 years school located in Santa Barbara, CA. It is accredited by WASC Senior College and University Commission.
The 2024 graduate tuition & fees of UCSB graduate schools is $14,453 for California residents and $29,555 for out-of-state. Its tuition is similar to the average graduate tuition of other public graduate schools (Research University with very high research activity), which is $29,093.
Total 2,961 students have enrolled in graduate schools at University of California-Santa Barbara.
University of California-Santa Barbara offers 106 graduate programs.
2024 Tuition & fees
The 2024 graduate tuition & fees at UCSB graduate schools is $14,453 for California residents and $29,555 for out-of-state students. The tuition & fees has increased by 2.01% from last year. The following tables show the 2024 graduate tuition & fees and the tuition trends over last 5 years at UCSB.
You can check and view more costs information including living costs, books & supplies, and tuition per credit hour at Cost of Attendance page
| Year | California Residents | Out-of-State | ||||
|---|---|---|---|---|---|---|
| Total | Tuition | Fees | Total | Tuition | Fees | |
| 2020 | $13,554 | $11,442 | $2,112 | $28,656 | $26,544 | $2,112 |
| 2021 | $13,568 | $11,442 | $2,126 | $28,670 | $26,544 | $2,126 |
| 2022 | $13,581 | $11,442 | $2,139 | $28,683 | $26,544 | $2,139 |
| 2023 | $13,872 | $11,700 | $2,172 | $28,974 | $26,802 | $2,172 |
| 2024 | $14,453 | $12,264 | $2,189 | $29,555 | $27,366 | $2,189 |
| Year | On-Campus | Off-Campus | ||
|---|---|---|---|---|
| Room & Board | Other Expenses | Room & Board | Other Expenses | |
| 2020 | $15,520 | $5,670 | $12,818 | $6,045 |
| 2021 | $15,903 | $5,381 | $13,188 | $5,916 |
| 2022 | $16,699 | $5,287 | $13,803 | $5,837 |
| 2023 | $16,883 | $5,059 | $14,246 | $5,622 |
| 2024 | $18,684 | $5,456 | $15,416 | $6,076 |
Offered Graduate Degrees and Major Programs
The graduate schools at University of California-Santa Barbara offers 188 major programs through Master's, Doctorate (Research), Post BS Certificate, degrees/programs.
You can view all major programs including undergraduate programs offered at Area of Study & Major Program page with completer and earning after graduation information.
| Number of Graduate Programs | Number of Online Graduate Programs | |
|---|---|---|
| Master's | 56 | 0 |
| Doctorate (Research) | 50 | 0 |
| Post-BS Certificate | 3 | 0 |
| Total | 188 | 0 |
| Program Name | Number of Completers |
|---|---|
| Education | 75 |
| Psychology (other) | 0 |
| Program Name | Number of Completers |
|---|---|
| Environmental Science | 90 |
| Electrical and Electronics Engineering | 55 |
| Physics | 37 |
| Computer Science | 28 |
| Management Science | 27 |
| Program Name | Number of Completers |
|---|---|
| Foreign Languages, Literatures, and Linguistics (other) | 4 |
| East Asian Languages, Literatures, and Linguistics | 1 |
Graduate Student Population
At UCSB, there are 26,420 students including both undergraduate and graduate students. Of that, 2,961 students have enrolled in graduate programs. By gender, there are 1,545 male and 1,416 female students are attending the graduate school. The male to female ratio is 1.09 to 1.
You can check and view more student population by gender, race, age, and online enrollment at Enrollment Statistics page.
| Total | Men | Women | |
|---|---|---|---|
| American Indian or Alaska Native | 14 | 5 | 9 |
| Asian | 347 | 173 | 174 |
| Black or African American | 106 | 40 | 66 |
| Hispanic | 346 | 156 | 190 |
| Native Hawaiian or Other Pacific Islander | 4 | 3 | 1 |
| White | 1,107 | 543 | 564 |
| Two or More Races | 25 | 10 | 15 |
| Race/Ethnicity Unknown | 35 | 23 | 12 |
| Total | 2,961 | 1,545 | 1,416 |
Similar Schools to UCSB
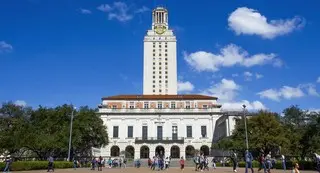
Austin, TX
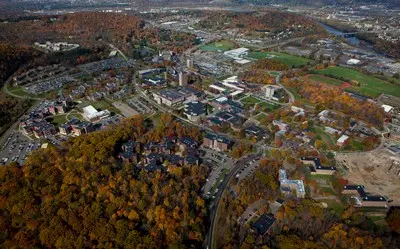
Vestal, NY
Norman, OK

Baton Rouge, LA

Storrs, CT